Viewing Active Sessions in Micro Edge
Overview
The Sessions viewer displays current sessions passing through your Micro Edge, providing a snapshot view of active traffic. This information is useful for troubleshooting purposes, as well as to get a sense of exactly what is occurring with your network at a given time.
Click Sessions in the navigation bar at the top of the screen to access this view.
Viewing Current Sessions
The Sessions viewer contains details about all active sessions at the time the page was loaded. To reload the page & refresh its contents, click the Refresh button at the top right-hand corner.
The default columns show a number of basic details about each session.
| Age | Duration of the session, displayed as hours : minutes : seconds . milliseconds. For example, a session with an Age attribute of 00:00:08.453 began approximately 8.5 seconds ago (as of the time the page was reloaded). |
| Application Name | If the traffic matches an application signature, this column displays which app generated the traffic. |
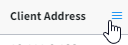
| Client Address | The IP address of the client device (i.e., the source). |
| Client Interface |
The Micro Edge interface on which the traffic originated. Local indicates the traffic is internal & did not leave the network. |
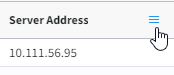
| Server Address | The IP address of the server device (i.e., the destination). |
| Server Interface |
The interface which directed the traffic to the server. For outbound traffic, this displays the WAN that was used. Local indicates the traffic is internal & did not leave the network. |
| Server Country | The physical/geoip location of the server, when available. |
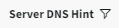
| Server DNS Hint | The DNS name associated with the server IP address, when available. This is usually blank for internal/local traffic. |
| Server Port | The port this traffic was sent to on the server. |
| Bytes | The total size of the session so far. |
| Byte Rate | Average throughput speed of the session. |
You can also click on any session to open the Session Details pane at the right-hand side of the screen. This pane displays more information about the selected session, including details that may not be included in the default columns.
You can add additional columns to the grid view to show more details. Hover your mouse pointer over any column header and click the three horizontal lines, then hover over the Columns entry to reveal additional columns that can be added to this view.
Filtering Sessions
There are two ways to filter the data shown in the Sessions viewer: globally or per-column.
Global Filtering
You can use the Search here… field at the top left-hand corner to apply a single filter to the entire Sessions view. Anything you type into this field will be checked against all attributes of each session. Only the ones which have an attribute matching your entry will be shown.
This option is great when looking for sessions matching a single criterion: all traffic from one host IP, all traffic generated by a particular application, all traffic using a specified WAN, and so on.
Per-Column Filtering
You can also add a filter to each individual column, which gives you the ability to create more complex filtering conditions. Hover your mouse over the header for the column you would like to filter and click the three horizontal lines to open the "additional options" menu, then type your desired filter condition into the Filter field.
A per-column filter modifies only that specific column. You can combine several per-column filtering conditions to create a more complex filter, such as "display all traffic from 192.168.2.25, using the Facebook application, passing through WAN 0".
When a filter condition is in effect for a given column, the header will display an icon:
Comments
0 comments
Please sign in to leave a comment.